MXC Pulse Screener+ for Crypto
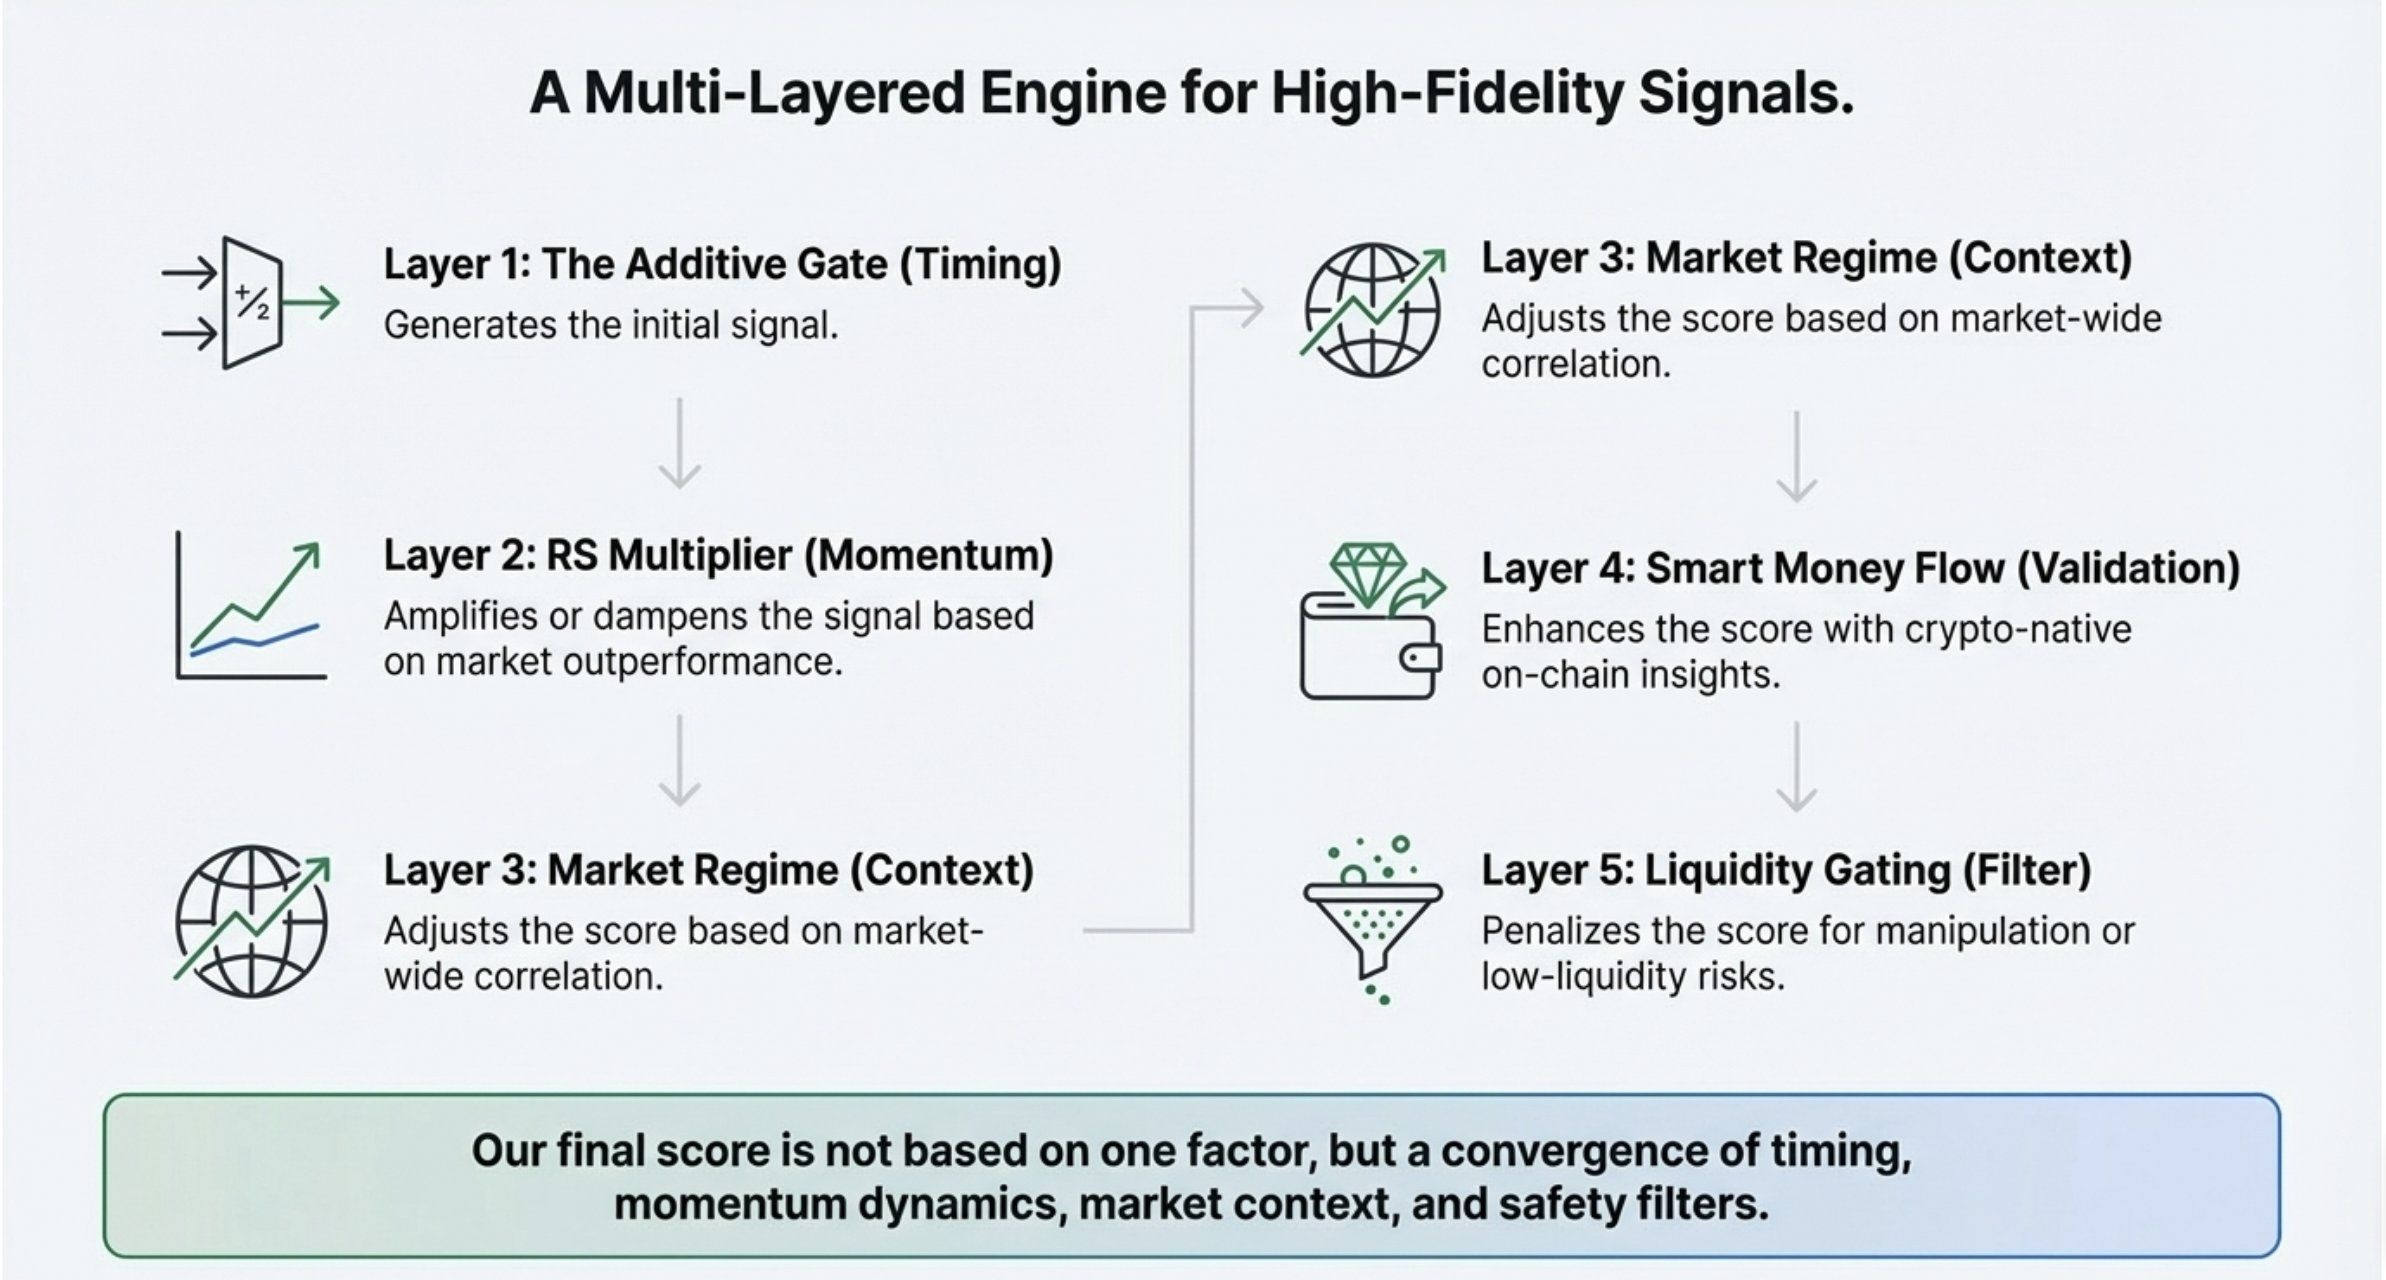
MXC Pulse delivers institutional-grade quantitative tools inside TradingView's crypto screener. It combines kinematic momentum modeling (velocity, acceleration, jerk) to predict breakouts 3–5 bars early, spot vs. perpetual flow analysis to detect institutional accumulation, and multi-benchmark relative strength ranking against BTC, ETH, and the market. These converge into a single percentile-ranked Breakout score, highlighting high-probability setups used by hedge funds — instantly accessible to every serious trader.
Written By MomentumX Capital
Last updated 6 months ago
Written By MomentumX Capital Last updated: Jan 2026 Link to TradingView
(this is invite only indicator)
What is MXC Pulse and Why Does It Exist?
MXC Pulse is a TradingView screener that delivers institutional-grade quantitative analysis to crypto traders.Traditional retail trading is slow and limited: manually reviewing charts one by one with basic indicators like RSI or MACD. It’s time-consuming, subjective, and hard to scale beyond a small watchlist.Institutions operate differently. They screen thousands of assets simultaneously using multi-layered quantitative models that track momentum kinematics (velocity, acceleration, and jerk for early inflection detection), cross-market flows (spot vs. perpetuals to identify accumulation), and relative strength across multiple benchmarks (BTC, ETH, and the broader market).MXC Pulse brings this professional approach to retail traders. It combines kinematic prediction, institutional flow detection, and composite relative strength into a single percentile-ranked Breakout score you can apply and sort across hundreds of coins in seconds.Its core principle is convergence: the highest-probability setups only emerge when timing, momentum, and flow signals align. This mirrors how quant desks and hedge funds isolate their best opportunities — cutting through noise and highlighting moves before price fully confirms.Built from the frustration of constantly arriving late to the real action, MXC Pulse gives serious traders the multi-dimensional edge once reserved for professional firms.
MXC PULSE Screener Overview - The why:
LINK HERE
Part 1: How to Use The Screener
How to Use MXC Pulse: Step-by-Step GuideMXC Pulse turns TradingView’s crypto screener into a powerful institutional-grade ranking tool. Follow these steps to scan hundreds of assets efficiently and surface only the highest-probability breakout setups.1. Set Up Your Screener Layout
Add the MXC Pulse indicator to your Screener.
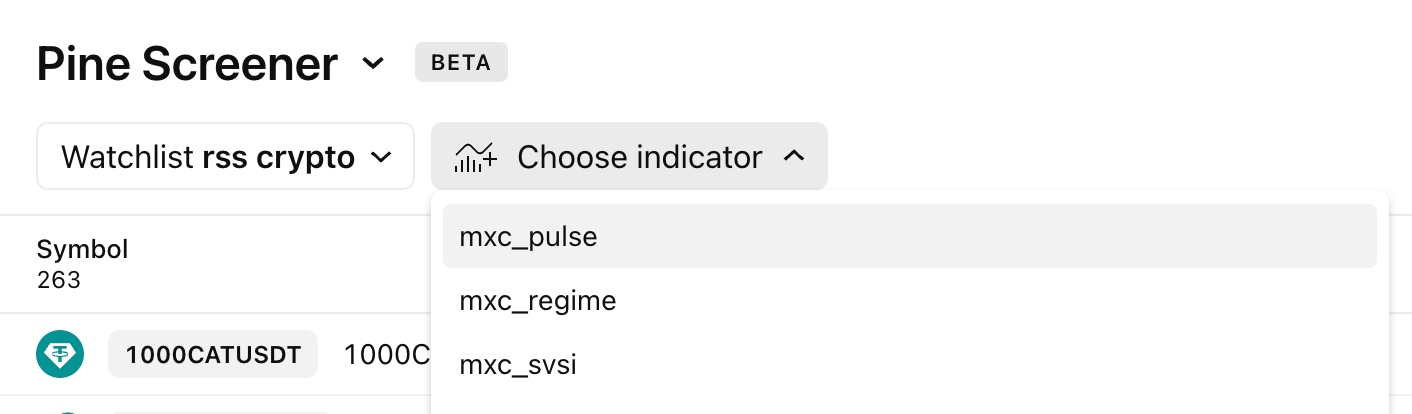
Go into settings: by clicking drop down on the indicator.
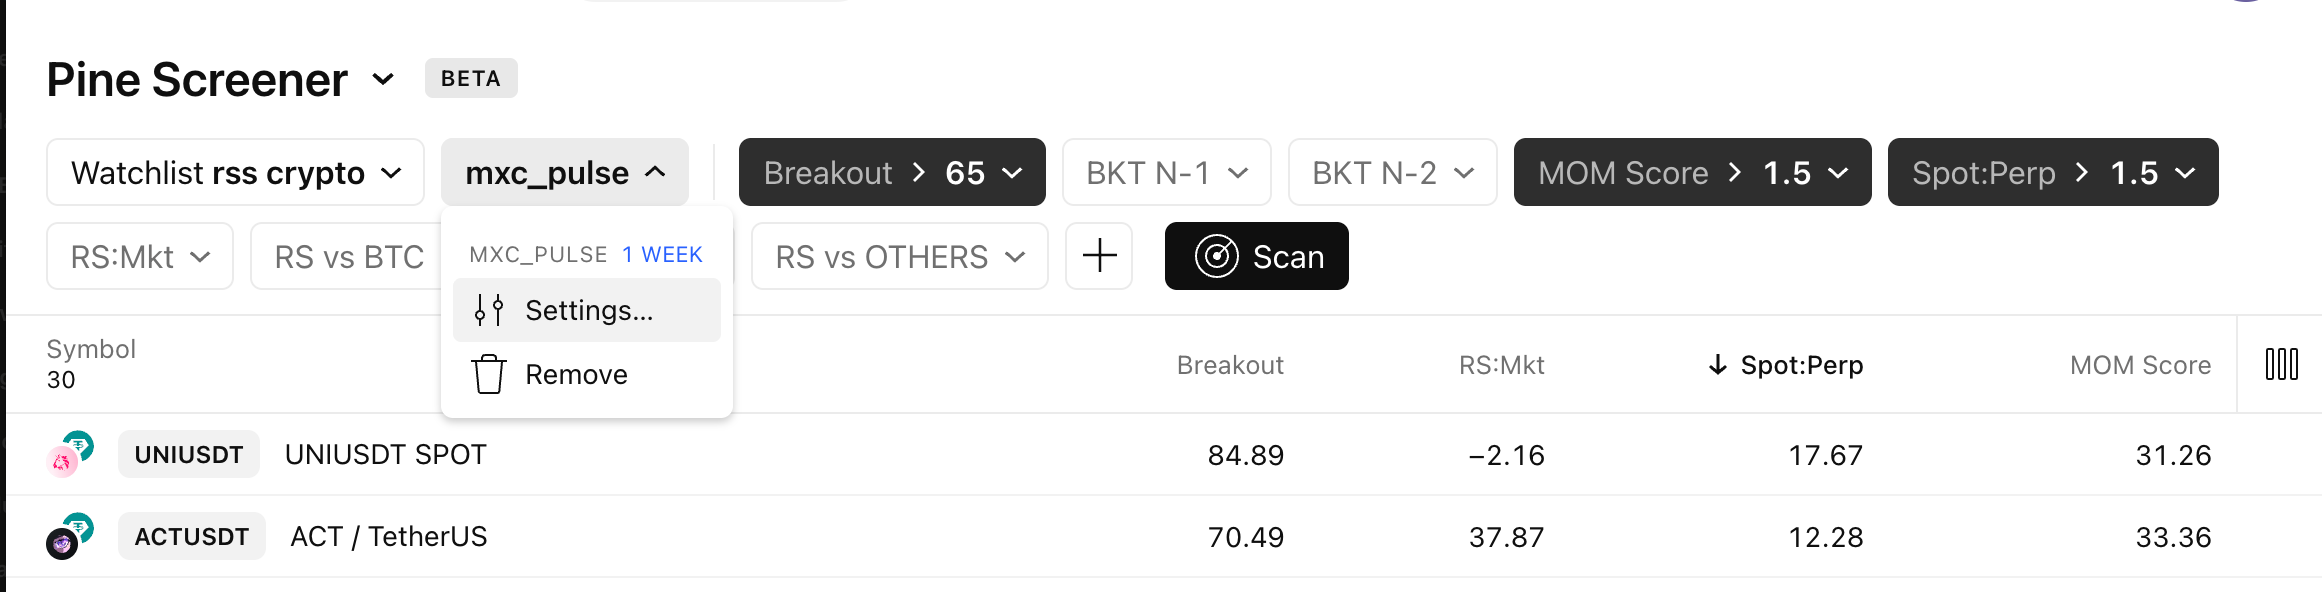
Set period to 1 Week.
Select the predefined watchlist with your Assets / Crypto Coins:
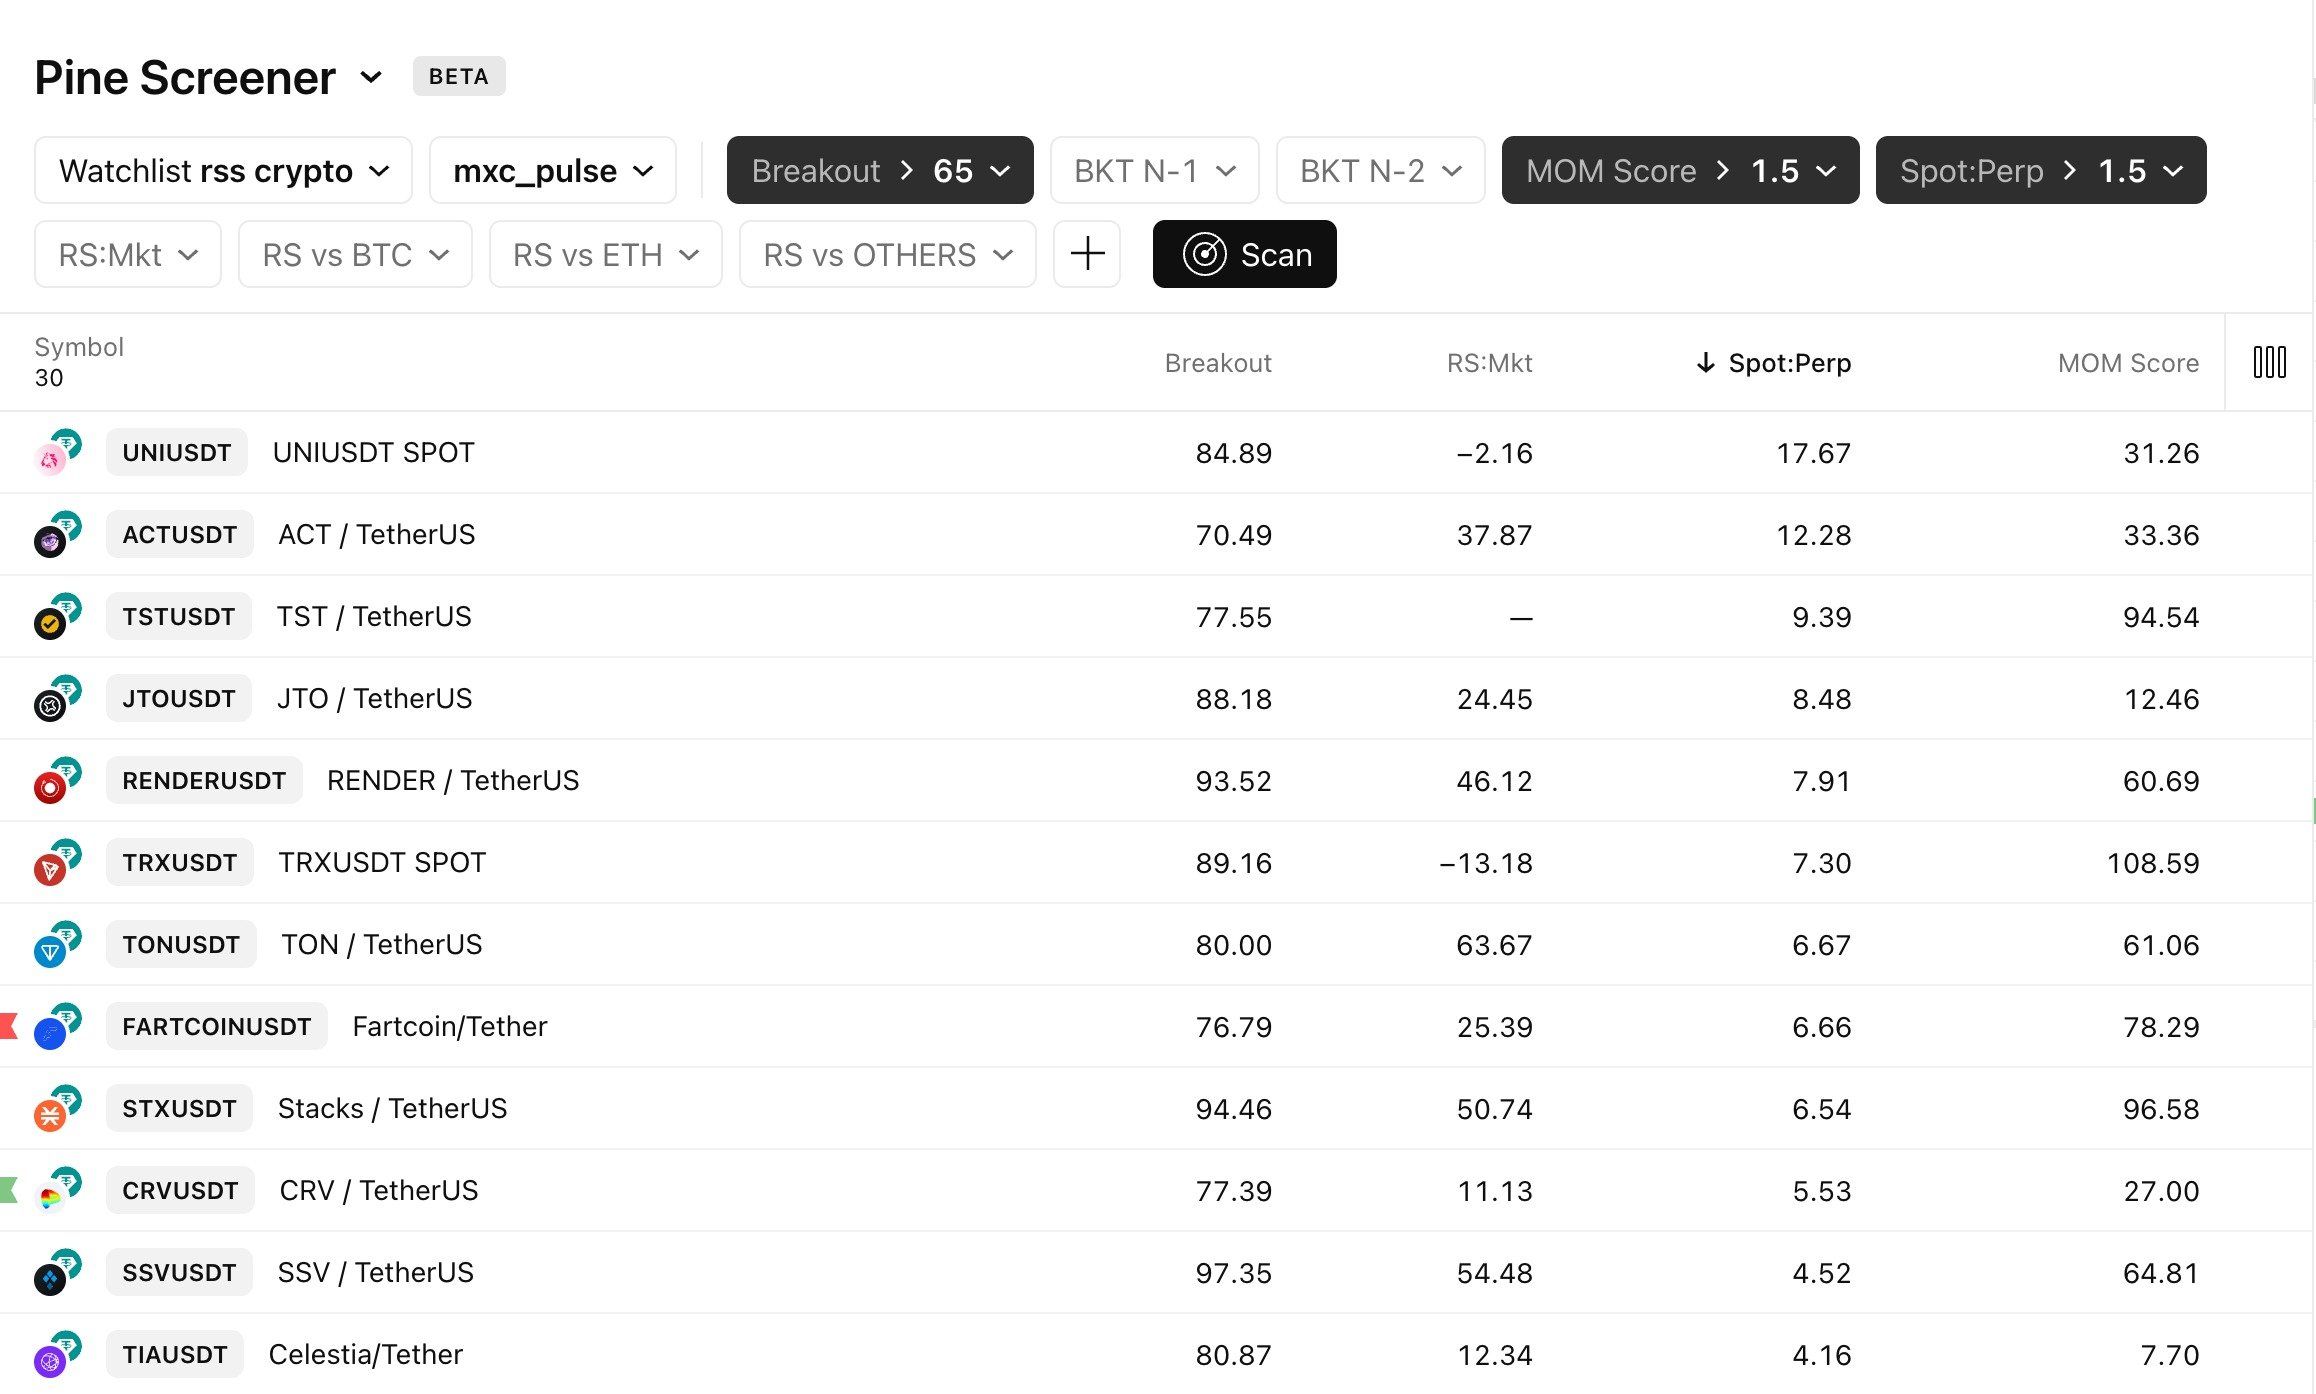
Optional: Customize your columns to include these essential metrics:
Click on Show Screener Values: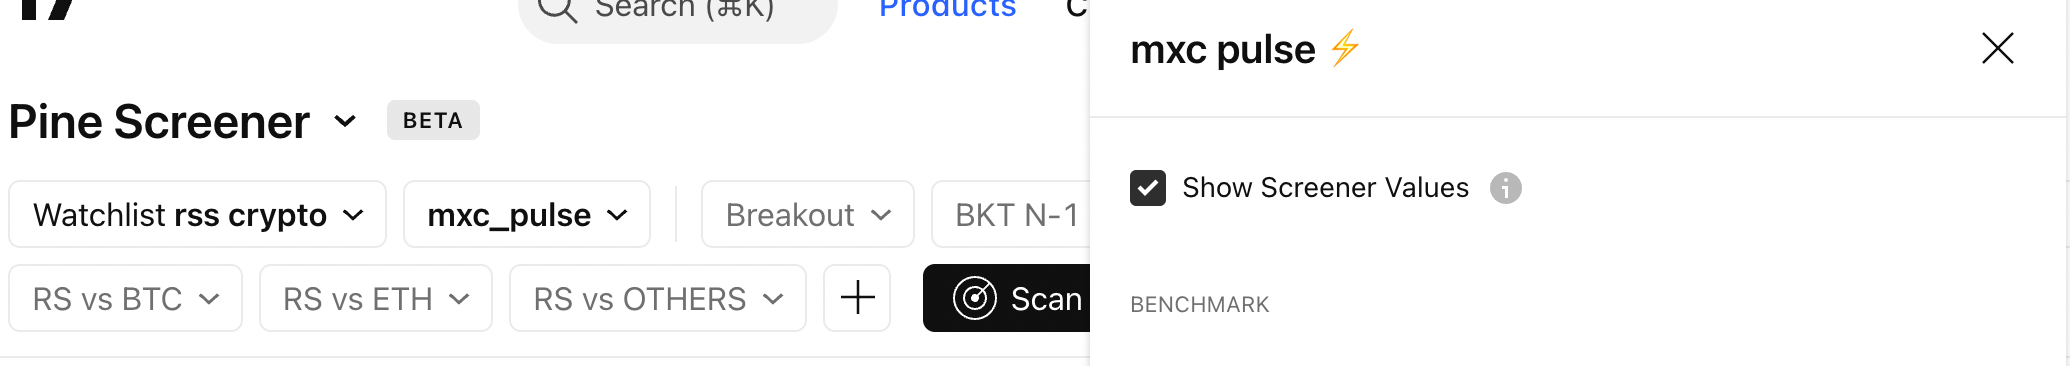
Breakout (main sort column)
RS:Mkt (relative strength vs. market)
Spot:Perp (institutional flow signal)
MOM Score (breakout timing)
BKT N-1 and BKT N-2 (previous breakout scores for momentum tracking)Click SCAN
Having these visible from the start makes every subsequent step faster and clearer.2. Run the Primary Scan
Sort the entire screener by Breakout in descending order.
This instantly ranks every asset by its current breakout probability (0–100 percentile).Focus first on the Sweet Spot: scores between 65–100.
These setups typically have strong convergence without being overextended.Ignore scores below 50 (low probability).
Part 2: Using Filters
3. Apply Confirmation Filters
Narrow the list to true alpha opportunities with these three core filters:
Breakout > 65 → strong overall convergence
RS:Mkt > -20 to 30 → asset is outperforming BTC, ETH, and the broader market
Spot:Perp > 2 → positive institutional flow (smart money accumulating spot)
Applying all three usually reduces hundreds of results to 10–30 high-conviction candidates.4. Check Momentum Acceleration & TimingFor each remaining asset:
Look at BKT N-1 and BKT N-2.
Rising sequences (e.g., 48 → 62 → 77) indicate building momentum and an early-stage move. Flat or declining sequences suggest potential distribution.Check the MOM Score.
Values 70–85 signal the breakout is likely within the next 3–5 bars — ideal timing for entry.
Click SCAN
Part 3: Confirming on Charts
5. Final Chart ValidationBefore committing capital:
Open the individual chart of your top candidates.
Use MXC CRYPTO or DUO to confirm buy signal.
You can also use MXC PULSE as a supporting indicator to see Relative Strenght and Breakout Scores.
Concept Video:
Stop chasing. Start Anticipating.
Analogy
Traditional scanning is like panning for gold in a miles-long river — exhausting and random.
MXC Pulse is like having a precision seismic scanner that pinpoints the richest veins beneath the surface. You stop digging everywhere and only invest effort (and capital) where the data shows the highest concentration of opportunity.Master this workflow and you’ll spend minutes — not hours — finding the setups professional traders target first. Happy hunting.
Disclaimer: This tool identifies high-probability patterns, not certainties. All trading and investment involve substantial risk. This guide is for educational purposes only. Start with small position sizes, learn the patterns, and always employ disciplined risk management.