MXC Smart Money Accumulation
The MXC VTM employs groundbreaking volume microstructure analysis that processes 100% of lower timeframe candles within each higher timeframe bar, revealing hidden institutional patterns through complete data analysis rather than sampling. The core innovation combines volume-weighted pressure calculation (body size × volume), multi-pattern institutional detection (5 distinct fingerprints), and adaptive timeframe selection that automatically optimizes analysis depth. The indicator detects volume/pressure spikes (2x volume + 1.5x pressure), price/volume divergences, hidden accumulation/distribution patterns, and algorithmic trading signatures (>10 small candles with >2% directional bias).
Written By MomentumX Capital
Last updated 12 months ago
Link to tradingview: mxc_ind_accumulation

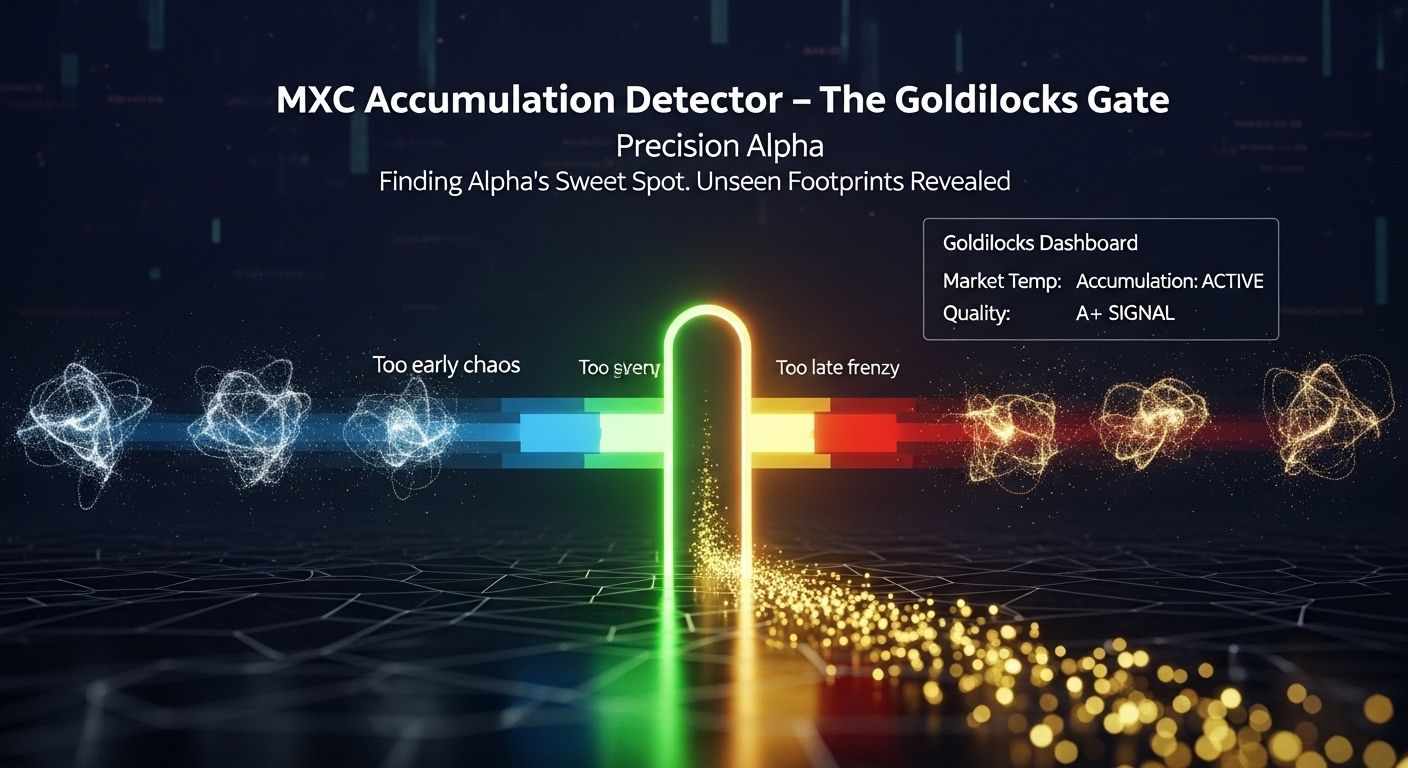
1. The Premise: Finding the Signal in the Noise
The most powerful trends are born in silence. While first-level thinking chases noisy breakouts, second-level thinking understands that fortunes are made by positioning during the quiet, often invisible, periods of institutional accumulation. The problem is that this smart money activity is deliberately obscured, making standard volume and momentum indicators dangerously blind.
The MXC Accumulation indicator was engineered to solve this. It is not another volume tool; it is our institutional smart money detection system. Its purpose is to analyze the market's microstructure, cut through the noise, and identify with high probability when sophisticated traders are methodically building a position before the markup phase begins.
2. The Engine Room: How It Works
To trust the signal, you must understand the engine. This indicator moves beyond simple price analysis to synthesize volatility, microstructure, and cross-timeframe data into a single, comprehensive score.
Core Innovation: Multi-Timeframe Microstructure Analysis
Technical Detail: The indicator processes every single candle from three strategically selected lower timeframes, weighted 25%-50%-25% to balance recent momentum with broader context. This multi-timeframe analysis is always enabled by design—there is no option to disable it because single-timeframe analysis is simply inferior.
The Edge: This is the difference between a single, flawed perspective and a high-conviction, three-dimensional view. By analyzing the complete order flow, we eliminate the blind spots of single-timeframe analysis and can confirm if accumulation is a genuine, market-wide phenomenon or just localized noise.
Advanced Scoring System: The Engineering Behind the Edge
Technical Detail: The indicator generates a 100-point score by synthesizing four distinct factors:
Williams VIX Fix (40 points): Uses gradual scoring based on z-score and percentile thresholds, not binary signals. A z-score ≥2 or 95th percentile earns full points, with partial credit for lower statistical significance.
Pressure Ratio (30 points): Analyzes bullish vs. bearish volume across all timeframes
Volume-Weighted Pressure (20 points): Detects institutional-sized orders
Multi-Timeframe Consistency (10 points): Rewards strong cross-timeframe alignment
The final score is smoothed with a 5-period EMA for stability and adjusted by environment multipliers: 1.0x in optimal zones, 0.85x when too cold, and 0.7x when overheated.
The Edge: This is a multi-point institutional audit. The indicator doesn't just look for one signal; it demands a confluence of evidence from volatility, volume pressure, and cross-timeframe alignment before it signals that smart money is at work.
Overview Video
3. The Usage Guide
This isn't just about finding a signal; it's about understanding the quality and context of an accumulation phase.
Setup & Configuration
From your TradingView chart, click "Indicators" and search for "MXC Accumulation."
Add it to your chart. The default settings are pre-calibrated for strategic positioning.
Key Input: The Enable Zone Detection setting is useful for position traders looking to identify sustained periods of accumulation (7+ bars at 65% threshold) rather than just initial signals.
⚠️ Critical Timeframe Requirements
This indicator is engineered to detect institutional campaigns, which unfold over weeks and months. Using it on low timeframes is a critical error.
Optimal: 12H, 1D, 3D, and 1W charts.
Degraded: 4H is the absolute minimum and will show more noise.
Broken: Intraday/sub-4H - DO NOT USE.
Signal Interpretation Guide 🎯
The Histogram:
🟢 Lime: Accumulation is ON. The indicator has detected a sufficient score to signal that institutional buying is likely underway.
⚪ Gray: Accumulation is OFF. Conditions for accumulation are not met.
The Info Table (Your Dashboard):
STATUS: A simple ON/OFF reading for the accumulation signal.
PRESSURE %: The ratio of bullish pressure. A reading above 60% during an ON signal shows strong conviction.
QUALITY: A real-time grade (A+, A, B, C) of the signal's strength. This is your primary guide to conviction.
CONSISTENCY: A metric (0-100%) that validates cross-timeframe alignment. A score > 70% is a high-conviction signal.
The Environment Filter:
ZONE (Optimal): The ideal environment for accumulation (momentum velocity between 15-50th percentile). Environment multiplier: 1.0x
HOT (>50th): Momentum is overheated. Be cautious of new entries, as the early opportunity may have passed. Environment multiplier: 0.7x
COLD (<15th): The market is extremely quiet. An accumulation signal here could be very early, representing higher risk but also higher potential reward. Environment multiplier: 0.85x
Position Sizing by Quality Grade
A+ Grade: 100% position size (highest conviction)
A Grade: 75% position size (strong conviction)
B Grade: 50% position size (moderate conviction, requires price confirmation)
C Grade: 25% position size (exploratory, use tight stops)
Actionable Playbooks
Playbook 1: The Major Bottom Hunt
Hunt: On a Daily or Weekly chart, wait for a lime Accumulation ON signal to appear after a significant markdown.
Confirm: Look for a Quality grade of A or A+ and a Consistency score >70%. This confirms a high-probability institutional base is forming.
Execute: Begin scaling into a position, using the quality grade for sizing. Place stops below the recent accumulation zone lows.
Manage: Hold as long as the weekly accumulation signal remains on, expecting a multi-week or multi-month markup phase to follow.
Playbook 2: The Accumulation Zone Rider
Context: An asset has bottomed and is in a sideways range. Enable Zone Detection in the settings.
The Signal: Look for multiple, consecutive lime histogram bars, indicating a sustained accumulation campaign.
The Entry: Scale into your position during this period, particularly on dips where the Pressure % remains high (>60%).
The Exit: The first major sign of weakness is the loss of the lime histogram signal on the weekly chart.
4. Second-Level Thinking: Risk & Context
A Howard Marks Caveat: Remember, this indicator identifies WHERE institutions are likely buying, not the precise moment WHEN the price will bottom. Accumulation can be a lengthy process. The signal gives you a probabilistic edge to build a position with patience, not a trigger for a high-leverage punt.
Multi-Timeframe Confluence
This principle is engineered directly into the indicator. The Consistency metric is your quantitative guide to confluence. A high score (>80%) means all three analyzed timeframes are in agreement, representing an exceptionally robust signal. A low score (<60%) is a clear warning of mixed signals.
Advanced Features (The Hidden Edge)
The Intelligent Environment Filter (COLD/ZONE/HOT) is a critical second-level tool. It provides crucial context about the market's momentum state through velocity percentile analysis, preventing you from chasing an accumulation signal too late into a move (HOT) and helping you understand the risk/reward of entering an early signal (COLD). The environment directly impacts your accumulation score through multipliers, ensuring the system adapts to market conditions.
Dynamic Threshold System
The indicator employs adaptive thresholds based on market environment:
ZONE environment: Standard thresholds (50/60/70 points)
COLD environment: Slightly higher thresholds to compensate for reduced multiplier
HOT environment: Significantly higher thresholds to filter out late-stage accumulation
5. The Bottom Line: Your New Edge
The market whispers its plans during accumulation. The MXC Accumulation indicator is the tool we engineered to listen. It moves beyond price to analyze volatility, microstructure, and cross-timeframe data, giving you a clear signal that smart money is building a position. It's not about catching the exact bottom—it's about positioning with conviction during the basing phase, long before the crowd arrives for the markup.
The always-on multi-timeframe analysis, gradual scoring system, and environment-aware multipliers ensure you're seeing the complete institutional picture, not just fragments. This is second-level thinking crystallized into code.
Note: Past performance does not guarantee future results. This tool provides probabilistic insights, not certainties. Always use proper risk management.