MXC Price Pressure
The MXC Price Pressure indicator employs a sophisticated triple-factor analysis system that combines MACD momentum (with EVWMA option), Adaptive RSI with Parabolic SAR overlay, and Order Flow Imbalance (OFI) scoring to detect institutional market pressure. The core innovation lies in its multi-dimensional pressure detection algorithm that evaluates each factor independently then synthesizes them into six distinct pressure states (extreme bullish to extreme bearish), with background color intensity reflecting conviction levels and smart money confirmation through OFI thresholds (>0.7 for extreme bullish, <0.3 for extreme bearish).
Written By MomentumX Capital
Last updated 11 months ago
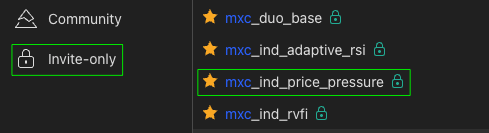
TradingView name: mxc_ind_price_pressure
1. The Premise: Finding the Signal in the Noise
Momentum is a liar. At least, that's what traditional indicators would have you believe. A simple MACD crossover or an overbought RSI reading is one-dimensional data in a multi-dimensional market. It tells you what happened, but not the conviction behind it.
This is first-level thinking, and it leads to chasing false signals, exiting winning trades too early, and missing the quiet accumulation that precedes explosive moves.
The MXC Price Pressure indicator was engineered to solve this. It is not another momentum oscillator; it is an institutional pressure detection system. It moves beyond single-factor analysis to synthesize three distinct dimensions of market activity—momentum, trend, and institutional order flow — into a single. Its purpose is to show you the difference between a fleeting price move and a true, institutionally-backed shift in market pressure.
2. The Engine Room: How It Works
To trust the signal, you must understand the engine. Price Pressure is a multi-stage system that evaluates the market through three distinct lenses, then synthesizes the results into a clear, quantifiable reading of market pressure.
Core Innovation: The Triple-Factor Analysis System
This is the core of our methodology. Instead of relying on one metric, Price Pressure validates each signal across three layers of analysis to build a high-conviction thesis.
1. MACD Momentum Pressure (The Engine):
Technical Detail: The system evaluates momentum using customizable MACD parameters (default: 12/26/8). It analyzes four distinct histogram states:
Rising positive (bullish acceleration)
Falling positive (bullish deceleration)
Rising negative (bearish deceleration)
Falling negative (bearish acceleration)
The indicator offers an optional Exponentially Volume-Weighted Moving Average (EVWMA) with a 10-period default, calculated as:

where VP is volume price, alpha is a smoothing factor, t is current, and t-1 is previous.
The Edge: This provides a nuanced view of momentum's acceleration and deceleration. Enabling EVWMA places more weight on price action during high volume periods, revealing what "smart money" is doing. All price data is pre-processed through a 3-period SuperSmoother (Ehlers filter) for noise reduction.
2. Adaptive RSI with SAR Overlay (The Guide):
Technical Detail: We apply a Parabolic SAR directly to our Adaptive RSI (8-period default, 6-period EMA smoothing), not to price. The SAR parameters are: 0.1 start, 0.03 increment, 0.2 maximum. When RSI is below its SAR, it indicates bullish pressure is in control, even if the RSI value itself is high.
The Edge: This is a powerful trend filter for momentum itself. It helps distinguish a healthy, sustained trend from a short-lived spike, preventing premature exits during powerful markup phases. The Adaptive RSI dynamically adjusts to market conditions and incorporates volume weighting for enhanced signal quality.
3. Order Flow Imbalance - OFI (The Confirmation):
Technical Detail: The final layer uses the strategic Order Flow Imbalance (OFI) score, which quantifies smart money activity on a 0-1 scale. Critical thresholds:
OFI >0.7: Strong institutional buying (extreme bullish)
OFI >0.6: Moderate buying pressure
OFI <0.4: Moderate selling pressure
OFI <0.3: Strong institutional selling (extreme bearish)
The Edge: This is the institutional footprint detector. An alignment of momentum (MACD) and trend (RSI-SAR) is a good signal. An alignment also confirmed by extreme OFI scores is a high-probability, institutional-grade setup.
State Persistence Logic
The indicator maintains the last valid pressure state until a clear shift occurs, preventing whipsaws in choppy markets. Once a pressure state is determined, it persists until contradictory signals emerge across multiple factors.
Overview Video
3. The Usage Guide
This isn't just about spotting colors; it's about building a repeatable, disciplined process.
Setup & Configuration
From your TradingView chart, click "Indicators" and search for "MXC Price Pressure"
Add it to your chart - appears as a separate pane with MACD line and background colors
The default settings are pre-calibrated for strategic positioning
Key Inputs:
MACD Settings: Fast (12), Slow (26), Signal (8) - adjust for market speed
Adaptive RSI: Length (8), EMA smoothing (6) - balance responsiveness vs stability
Parabolic SAR: Start (0.1), Increment (0.03), Max (0.2) - controls RSI trend filter sensitivity
Use EVWMA: Enable for volume-sensitive MACD analysis in trending markets
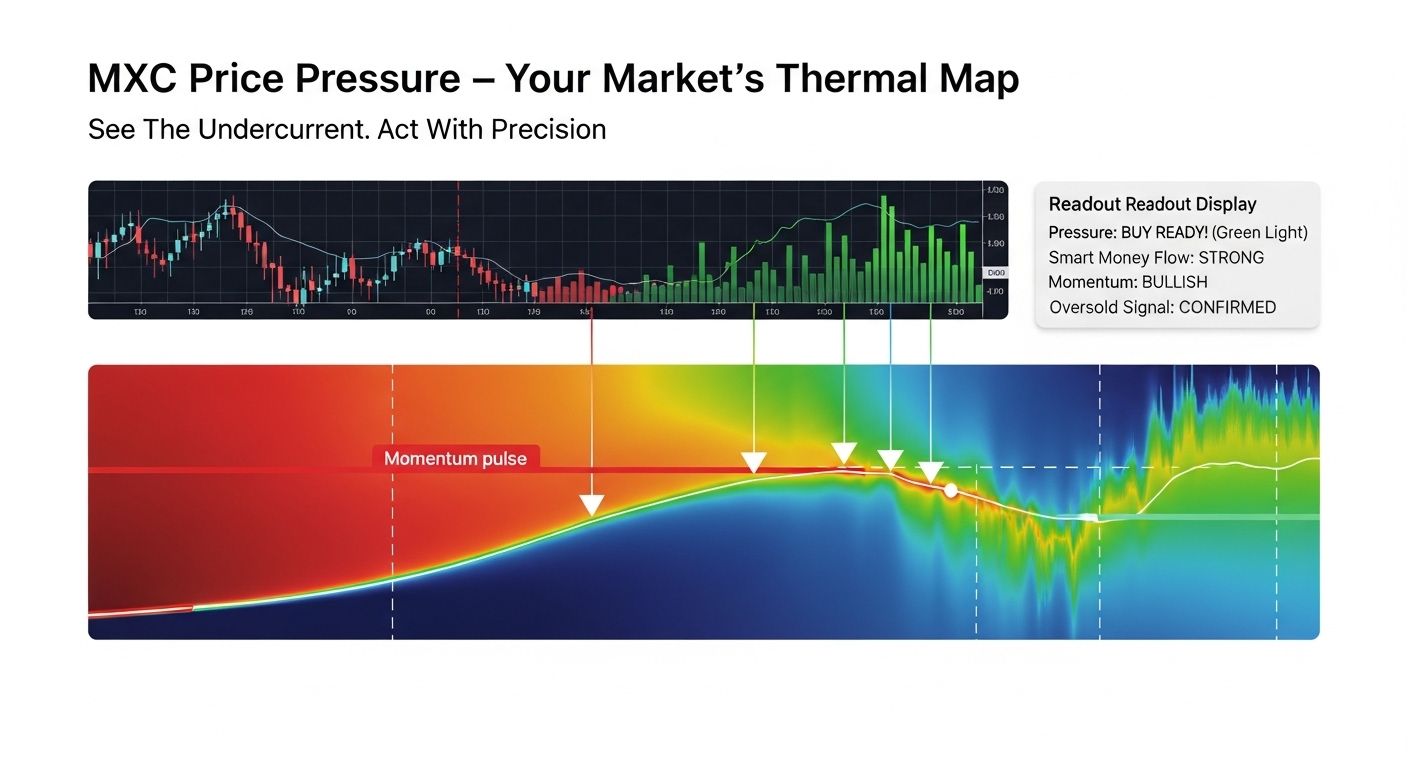
Show Info Table: Displays real-time pressure state, OFI score, MACD/RSI status
⚠️ Critical Timeframe Requirements
The Price Pressure indicator is engineered for strategic analysis. Using it on improper timeframes will degrade the signal.
Optimal: 4H+ charts for crypto and Daily+ charts for traditional markets
Broken: Intraday/sub-daily timeframes produce unreliable noise
Signal Interpretation Guide 🎯
The background color is your primary signal, indicating the synthesized pressure state:
🟢 Bright Green (Extreme Bullish): All three factors aligned + OFI >0.7. Smart money is in full control
🟢 Dark Green (Strong Bullish): MACD & RSI-SAR bullishly aligned. Institutional momentum building
🟢 Light Green (Weak Bullish): Partial bullish alignment. Momentum may be building or waning
🟠 Orange-Yellow (Weak Bearish): Partial bearish alignment. Use caution, potential shift ahead
🔴 Orange-Red (Strong Bearish): MACD & RSI-SAR bearishly aligned. Distribution in progress
🔴 Dark Red (Extreme Bearish): All three factors aligned + OFI <0.3. Smart money actively selling
Visual Enhancements:
MACD Line: Lime when above signal (bullish), red when below (bearish)
Crossover Dots: Appear at MACD/Signal crosses, sized by significance
Info Table: Real-time display of all factor states and values
Position Sizing by Pressure State
Extreme (Bright Green/Red): 100% position size (highest conviction)
Strong (Blue-Green/Red-Orange): 75% position (standard conviction)
Weak (Green/Orange): 50% position (exploratory/scaling)
Counter-trend Signal: 25% max size (high-risk contrarian)
Neutral/Gray: No new positions (await clear pressure) or insufficient history / volume
Actionable Playbooks
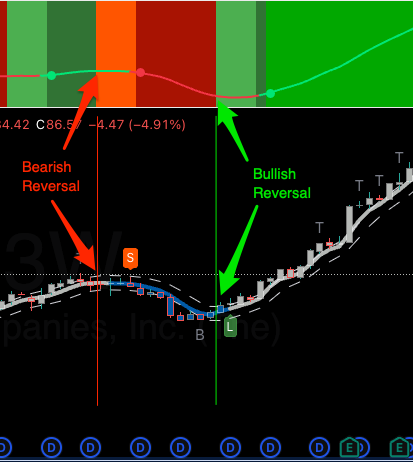
Playbook 1: The Pressure Reversal
Hunt: Wait for extended period in extreme zone (bright green/red)
Confirm: Watch for first pressure reduction - downgrade from "Extreme" to "Strong", or flip from green/red
Execute: Enter contrarian position as pressure weakens, stop at pressure state change
Manage: Target return to "Weak" pressure zones for initial profits (light green for shorts, orange-red for longs).
Playbook 2: Top Detection by Using Price Pressure with Adaptive RSI
Context: Look for a bearish shift in Price Pressure from Green to Yellow, or Orange/Red.
Adaptive RSI Confluence: at the same time, look for Adaptive RSI to change from Overbought, to declining - the line changes from Red to White, as RSI declines.
Optional: look for Top “T” signals on the Duo Lens Indicator that you are using - for optional confirmation that we are reaching the top.
The Exit: If you have this setup - this is likely the top - this works well on HTF (>1W) and LTF timelines, but works best on HTF.
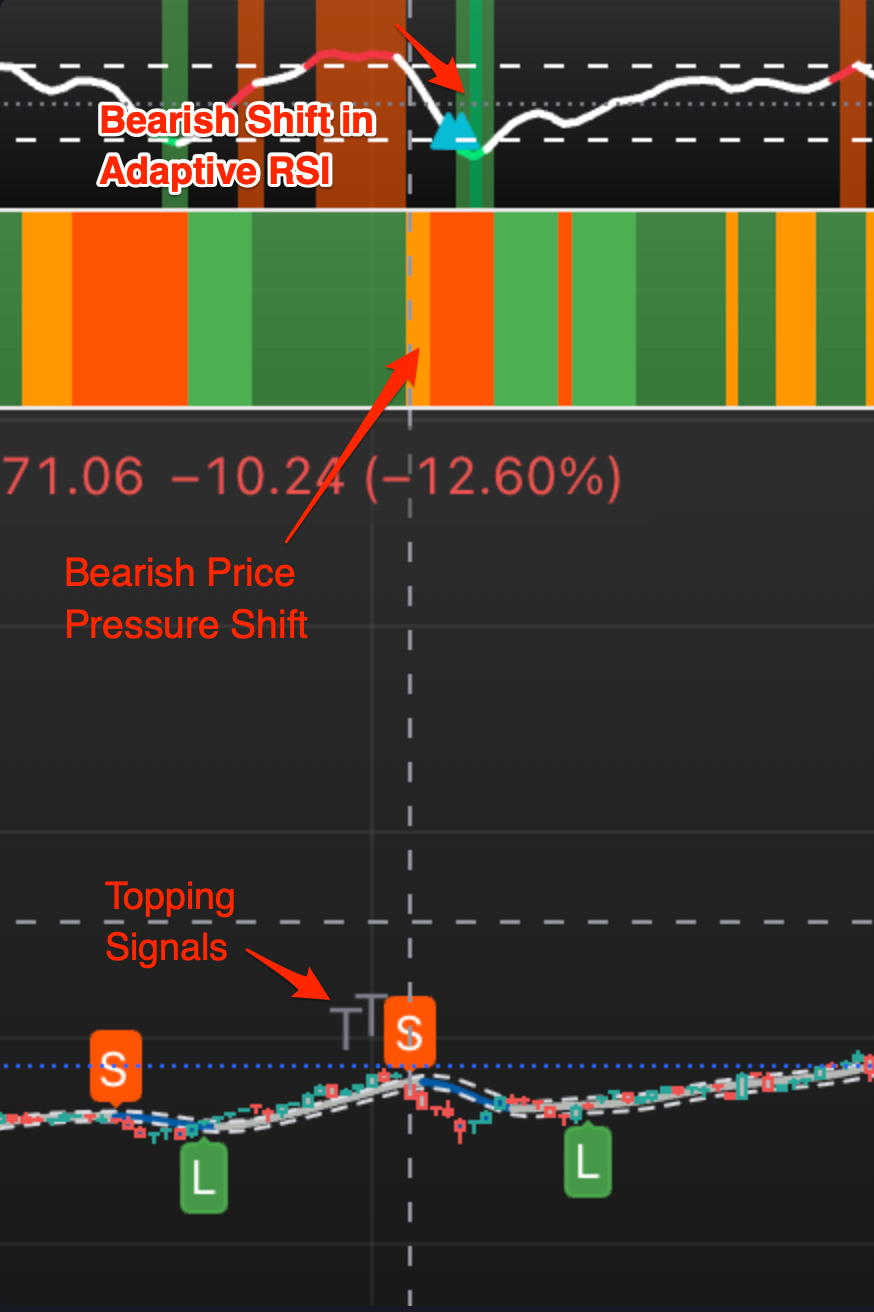
You will notice that price pressure may give earlier signals than the Duo Lens Indicators - serving not only as confirmation, but also as an early signal.
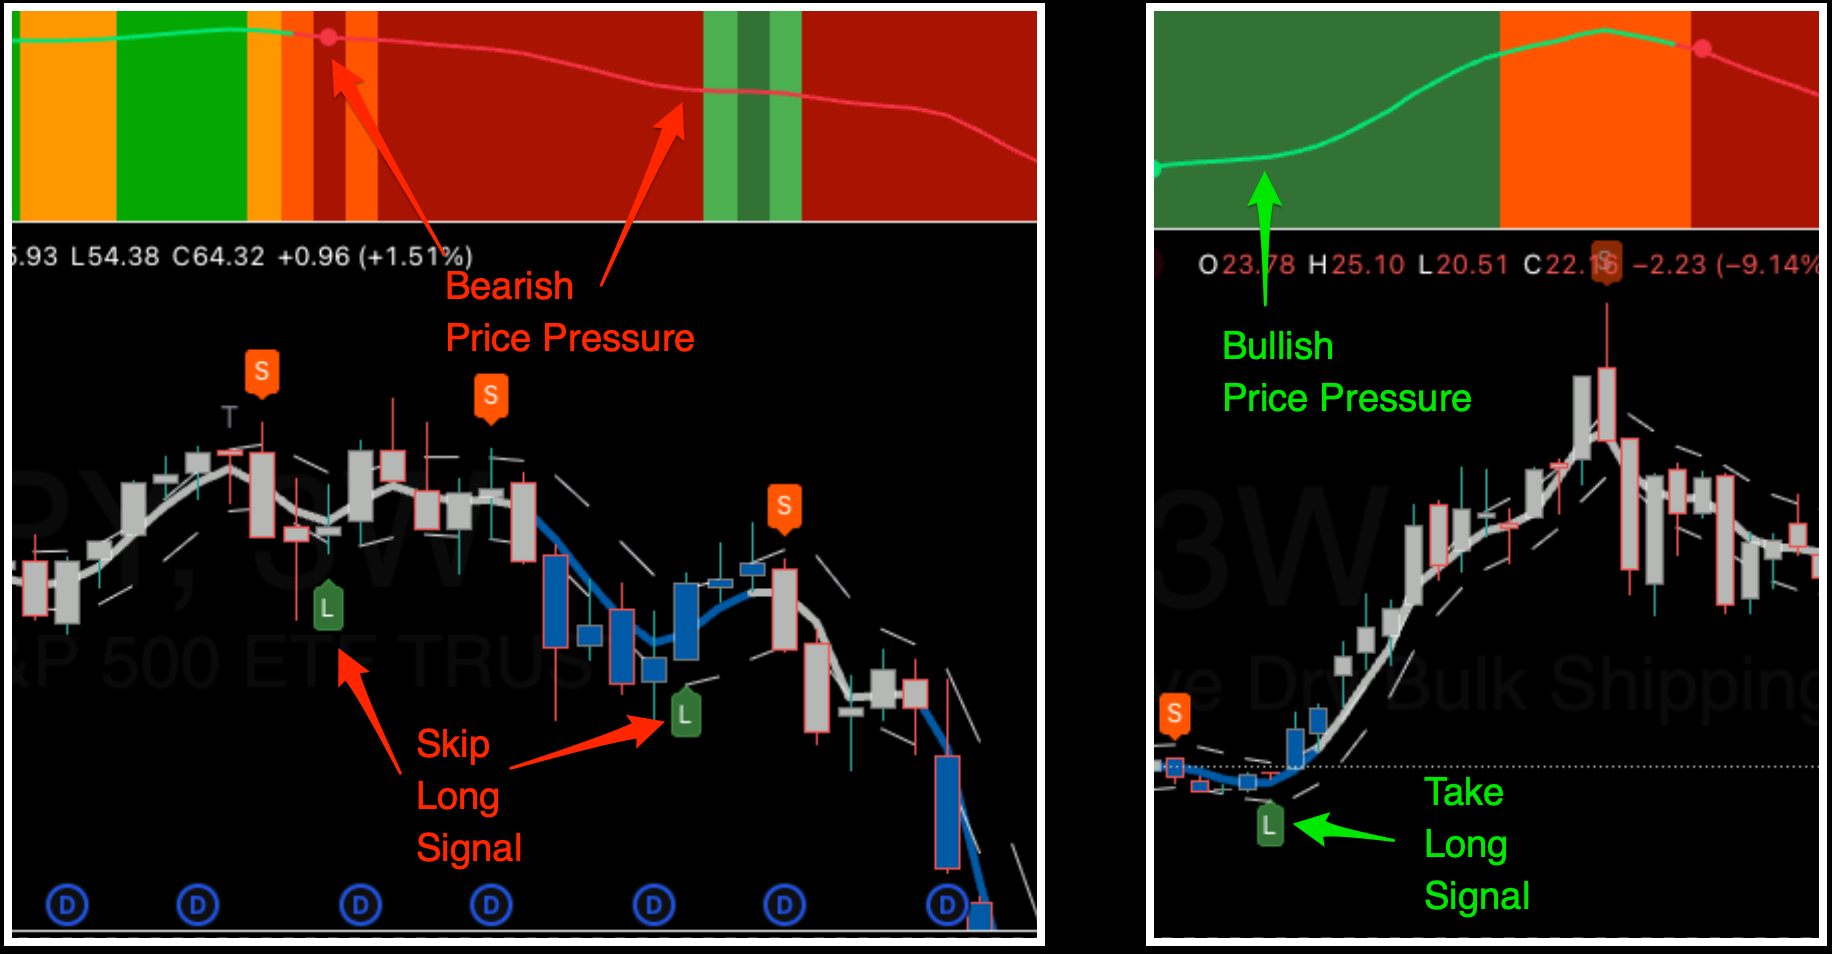
Playbook 3: Price Pressure can be used as a filter or confirmation of a buy/sell signal - for example if you have a buy signal, but price pressure is red / negative - in that case it is better to skip the buy, and wait for a better signal or confirmation.
Context: Validate the state of the Price Pressure, check if it is Green or Red.
Confirm / Validate Buy Signal: If you have a Duo-Lens “L” (Long) signal - but Price Pressure does not support it (Red / Orange), skip the “Long” signal.
Confirm / Validate Sell Signal: If you have Duo-Lens showing a “S” (Sell) signal - but Price Pressure does not support it (Green), skip the “Sell” signal.
Note: you can also cross validate with VTM / Volume Pressure indicators - if the duo lens signal is not supported by Price Pressure or VTM, it is better to skip the signal.
Note: generally most confident signals are a combination of Price Pressure and Volume Pressure (VTM) - when Price and Volume Pressure align, it provides a strong confirmation, and often precedes the “S” (Sell) or “L” (Long) signals in the Duo-Lens core indicators.
4. Second-Level Thinking: Risk & Context
A Howard Marks Caveat: Remember, these are probabilities, not certainties. The goal is not to be right 100% of the time, but to structure your trades so that your winners are multiples of your small, controlled losers. A pressure signal is an edge, and a confirmation signal, not a guarantee.
Multi-Timeframe Confluence
While this indicator incorporates multiple factors, the principle remains: a signal on your primary timeframe is an observation. A signal that aligns with the pressure state on the next lower timeframe is a high-conviction thesis.
Always check the if Lower Timeframe supports the Higher timeframe move - ex. check 4D LTF vs. 2W HTF - if you are making trades on higher timeframes.
Advanced Features (The Hidden Edge)
State Persistence: Maintains last pressure state until clear shift, preventing choppy whipsaws
EVWMA Integration: Volume-weighted price for MACD tracks institutional momentum with precision
SuperSmoother Processing: 3-period Ehlers filter reduces noise before all calculations
Dynamic Visual Feedback: Line colors, crossover dots, and info table provide multi-layered confirmation
5. The Bottom Line: Your New Edge
Stop looking at momentum in a vacuum. The MXC Price Pressure indicator provides a comprehensive, three-dimensional view of the market. It reveals the difference between a fleeting price move and a true, institutionally-backed shift in pressure.
By combining MACD momentum analysis with Adaptive RSI trend filtering and OFI smart money detection, you gain an institutional-grade framework that adapts to market conditions while maintaining clarity. The visual simplicity of color-coded pressure states, combined with the sophisticated triple-factor analysis engine, delivers professional insights in an intuitive interface.
This is the tool for trading with conviction.
Note: Past performance does not guarantee future results. This is a tool for strategic positioning, not a crystal ball. Always use proper risk management.